


?")


In these blogs, lets us see how we can do aggregations and windowing operations in Apache Spark Streaming Dstream.
Let us consider an example where we will be receiving data from twitter based on some keyword filters. You can consider “Trump” as a keyword for now. We will be receiving a continuous stream of data that has a “Trump keyword” in its twitter message or text.
Now we have to find out the location from where we are receiving the maximum number of tweets on filter condition i.e., we are aggregating the data analytics services and finding out the location.
We also want to know the counts in a time window, say for example let’s consider a time window of 30 seconds and a sliding window of 10 seconds. It means we should get the max count from the last 30 seconds every 10 seconds.
Format : HH:MM:SS
00:00:00 – 00:00:10 => 1st window
00:00:00 – 00:00:20 => 2nd window
00:00:00 – 00:00:30 => 3rd window
00:00:10 – 00:00:40 => 4th window
00:00:20 – 00:00:50 => 5th window
00:00:30 – 00:00:60 => 6th window
…
Now let us write code.
First, we are going to import all the required packages.
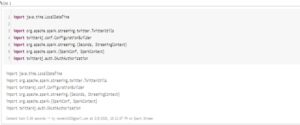
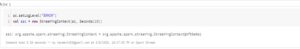
Now we are going to set the log level to “error” so that it will not generate so many logs and create a Spark streaming context.
Now let us create a configuration builder and set all our access keys and access token secrete keys to it. Let’s pass this Configuration builder object to OAuth and the create a twitter stream using it.
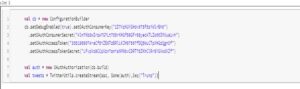
Note: Please don’t use the keys available in the screenshot. I have already deleted them. Please create your own keys by signing up for a twitter developer account.
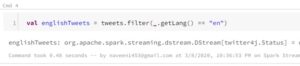
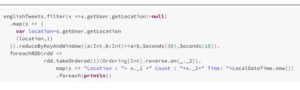
Now let’s filter out to get only English language tweets.
Now let us filter out those tweets whose location is null and create a tuple of (location,1). Then let us do reduceByKeyAndWindow and provide window time and sliding time.
Then let us find out where we are getting the maximum tweets from the last 30 seconds time interval with every 10 seconds sliding by doing ordering on the aggregated data.
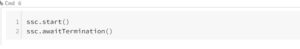
Now let us start streaming and make it to wait until streaming is terminated so that it will keep on streaming twitter data and process it.
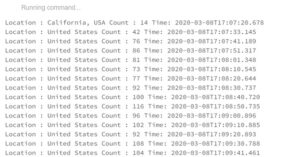
Now let us see how many counts we have every 30 seconds with 10 seconds time interval.


